Source: Heckenbach, I., Peila, R., Benz, C. et al. Cellular senescence predicts breast cancer risk from benign breast disease biopsy images. Breast Cancer Res 27, 37 (2025). https://doi.org/10.1186/s13058-025-01993-z
Background
Of the 1.5 million breast biopsies performed annually in the United States for abnormalities on mammography or physical examination, about 80% are negative for malignancy [1, 2]. These biopsies mostly show benign breast disease (BBD), which is composed of a wide spectrum of pathological entities generally classified as non-proliferative, proliferative without atypia, and proliferative with atypia [3]. Risk of breast cancer is relatively unchanged in those with non-proliferative changes, increased by approximately 50–80% when there is proliferative pathology without atypia, and by 300–400% in women with proliferative disease with atypia [3,4,5]. Accurately estimating risk for women within each category of BBD is of great importance for informing clinical management, with the potential for improved outcomes and more efficient use of resources.
Cellular senescence is a cell state canonically characterized by permanent cell cycle arrest and resistance to apoptosis. Senescent cells remain metabolically active and give rise to the senescence-associated secretory phenotype (SASP) characterized by the secretion of immune modulators, cytokines, growth factors, proteases and other pro-inflammatory substances [6, 7]. SASP expression is thought to have extensive physiologic and reparative roles. However, its relationship to breast cancer development is complex, having been reported as both tumor-promoting and tumor-protective [8]. Indeed, its exact role in the etiology and progression of breast cancer is still being determined.
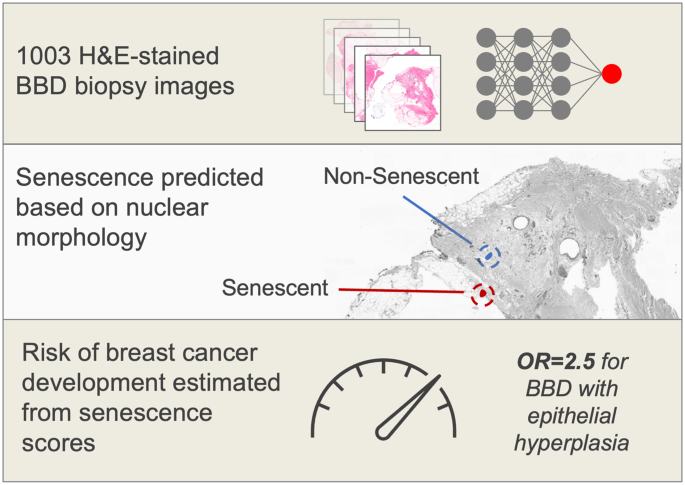
Prior work has shown that senescent cells can be identified from morphological changes observed in the cell nucleus using techniques such as deep learning [9]. We recently found that these senescence predictive models can be used to estimate the risk of breast cancer development from normal biopsies from healthy women based on the number of senescent cells in different tissue compartments [10]. These findings suggested that senescence prediction could be a potential option for risk stratification of women with BBD, which could represent a considerable advancement in our ability to advise women who have undergone biopsies without a malignant diagnosis. In the study reported here, we evaluated these models on histological images from women whose biopsies showed BBD to assess their potential as novel risk predictors and to further advance knowledge of the role of senescence in breast cancer development (Fig. 1).
Methods
Study design
A description of the underlying study in which the present investigation was conducted has been presented in detail elsewhere [11]. In brief, we conducted a case-control study nested within a cohort of 15,395 women aged 21 to 85 years who received a histopathologic diagnosis of benign breast disease (BBD) within the Kaiser Permanente Northwest Region (KPNW) health care system between August 3, 1971 and December 31, 2006 and were followed until July 1, 2015.
Cases and controls
Cases were women with a biopsy for BBD who developed a subsequent first diagnosis of invasive breast cancer (IBC) at least one year after the index BBD biopsy and were ascertained by linking records from the BBD cohort to the KPNW Tumor Registry. The KPNW Tumor Registry has an excellent follow-up rate, even for women who are no longer health plan members, and it maintained a followup rate of 98% of patients (living and dead) during the time period of the study. Women who were diagnosed with ductal carcinoma in situ prior to the first BBD biopsy or were diagnosed with IBC prior to or within a year of the BBD biopsy were excluded from the study, as were those who had no breast tissue in the biopsied material. For each case, we randomly selected one control from the BBD cohort using risk-set sampling. Each control was individually matched to the corresponding case on age at diagnosis of BBD (+/- 1 year) and was sampled randomly from the risk-set with replacement [12]. In addition to being alive and free of invasive breast cancer during the same follow-up period as that for the corresponding case, each eligible control had not undergone a mastectomy before the date of diagnosis of breast cancer for its matched case.
Histopathology
We obtained BBD tissue blocks for the cases and controls. Hematoxylin and eosin (H&E) stained sections prepared from the blocks were reviewed by a breast pathologist who was blinded to the case-control status of the study subjects. The BBD lesions were classified according to the well-established criteria of Page and colleagues [3, 13,14,15] as follows: no lesions/non-proliferative lesions (cysts, fibrosis, apocrine metaplasia, adenosis, simple fibroadenoma); proliferative disease without atypia (mild, moderate, or florid epithelial hyperplasia; columnar cell change and columnar cell hyperplasia; complex fibroadenoma; sclerosing adenosis; radial scar; complex sclerosing lesion, papilloma); and proliferative disease with atypia (atypical ductal hyperplasia, atypical lobular hyperplasia, columnar cell change and columnar cell hyperplasia with atypia/and flat epithelial atypia).
Senescence prediction
The H&E sections were scanned with a Panoramic 250 High Capacity Slide Scanner (3D Histech) using brightfield with a 20× air objective, numerical aperture 0.8. Cellular senescence was predicted from nuclear morphology observed in the scanned H&E images of BBD tissue using AI methods. To this end, whole slide images were processed by splitting them into 2048 × 2048 pixel tiles and then rescaling by 50% to 1024 × 1024 pixels. Of the 1,652,812 tiles extracted, 60 tiles were randomly selected for annotation, where we identified nuclei in samples drawn from the major tissue types (epithelial, stromal, and adipose tissue). A segmentation model based on U-Net [16] was trained to identify nuclei for the samples and then applied to segment nuclei across the entire set of image tiles. We also applied segmentation models that we had previously trained to identify adipose and epithelial tissues [10] and a published model to identify terminal duct lobular units (TDLUs) [17]. Nuclei classified as TDLU were excluded from the epithelial type, leading to epithelial nuclei classified as either TDLU or non-TDLU epithelial tissues. Collecting the 8,305,727 identified nuclei, we applied five senescence prediction models, each previously trained on fibroblasts in cell culture using different senescence inducers, including ionizing radiation (IR), replicative senescence (RS), doxorubicin (Doxo), antimycin-A (Anti), and atazanavir-ritonavir treatment (Atvr) [9]. We also evaluated senescence using a model that was trained on all three drug treatments together (AAD) due to our previous observation that there is a high association per nucleus between scores for these treatments [10]. Each model is based on an ensemble of 10 independent neural networks, where results are averaged together by model, as described in our previous work. After generating scores for each nucleus, scores were averaged by model and tissue per individual.
We investigated spatial patterns of cellular senescence in breast tissue by identifying the nuclei within the top 10th percentile of scores and then examining the scores of surrounding nuclei by distance. Based on patterns observed during the analysis, we fit negative exponential curves to the scores of all nuclei of the same tissue type near high-scoring nuclei (Supplementary Fig. 1a). Curves with fits of R2 > 0.1 were classified as good fits because they generally showed a negative exponential pattern. To characterize these patterns, we focused on two spatial metrics, percent difference and half-life (Supplementary Fig. 1b). The first and last fit points were used to calculate the percent difference, showing the magnitude of senescence score change between the nearest and farthest buckets, which were defined as 0–233 μm and 2097–2330 μm. Additionally, we calculated half-life to determine the rate of exponential senescence decay by distance. Senescence prediction and spatial analysis were performed with Python, Keras, and SciPy.
Covariates
Risk factor data were obtained by abstraction from the KPNW medical records using a chart abstraction manual and included information on age at menarche; age at first live birth; number of pregnancies; menopausal status; family history of breast cancer in a first degree relative; height; weight; cigarette use (ever/never), ever use of postmenopausal hormone therapy (HT), and history of bilateral oophorectomy.
Analytical sample
In the present study, we excluded samples whose senescence scores were calculated using ≤ 100 cells, as the data for this group were considered to be less reliable. To maximize the sample size of the study, all cases and controls whose senescence scores were estimated based on more than 100 cells were included in the analysis, regardless of the presence/absence of their matched counterpart. The final sample size included 1,003 women (491 controls and 512 cases) for the epithelial tissue analyses, 712 (358 controls and 354 cases) for the fat tissue analyses, 1,006 (492 controls and 514 cases) for the stromal tissue analyses, and 937 (465 controls and 472 cases) for the TDLU tissue analyses.
Statistical analysis
Correlations between the senescence scores in the different tissue types (epithelial, adipose, stromal and terminal duct lobular units) obtained using the 3 different prediction models (RS, IR and AAD) and the spatial senescence metric data were calculated using Spearman correlation coefficients.
Unconditional logistic regression was performed to estimate age-adjusted and multivariable odds ratios (OR) and 95% confidence intervals (CI) for the associations of the senescence scores with breast cancer risk. Age was included as a covariate in the regression models to account for the potential residual confounding effect of age, although we note that the case-control pairs were closely matched on age (Supplementary Table 1). For this purpose, senescence scores and spatial decay metrics were each categorized into quartiles (qt), with the lowest quartile serving as the reference group in the analyses. Covariates were included in the models if they were known risk factors for IBC or if adjustment for them resulted in a change in the estimated OR of ≥ 10%. The following variables were adjusted for: cigarette smoking status (yes/no), BMI (calculated close to the date of BBD diagnosis by dividing weight (kg) by the square of the height (m [2]) (< 18.5, 18.5–24.9, 25-29.9, ≥ 30 kg/m2), family history of breast cancer in a first degree female relative (yes/no), age at menarche (≤ 11, 12–13, ≥ 14 years), age at first live birth (never had, 15–19, 20–24, 25–29, ≥ 30 years), number of pregnancies (never pregnant, 1, 2, 3, ≥ 4), history of bilateral oophorectomy (no/yes), HRT use (no/yes), and menopausal status (premenopausal/postmenopausal). Women were considered to be post-menopausal if they had had a natural menopause, were aged at least 53 years [18] and did not report their menopausal status, or had had a bilateral oophorectomy before this age. All variables with missing information were assigned a missing value indicator for the analyses. To test for linear trend, senescence score quartiles were included in the model as continuous variables and Wald test p-values were calculated.
In further analyses, we examined the association of combined pairs of senescence scores in epithelial and adipose tissue obtained using the RS and IR models with the risk of IBC using as reference groups the quartiles which showed the lowest risk when analyzed as individual scores (1st quartiles of these scores). A similar approach was adopted for combined analysis of senescence scores (RS-epithelial) and spatial decay metrics (percent-difference-epithelial). Additionally, subgroup analyses were performed by menopausal status and by BBD histopathological classification (no lesions/non-proliferative lesions and epithelial hyperplasia with/without atypia). Finally, we examined the association between senescence scores and the risk of developing ipsilateral or contralateral IBC using multinomial logistic regression, so that the risks of these two outcomes were estimated simultaneously [19].
All statistical analyses were performed using Stata version 18 (StataCorp LLC, College Station, TX). All p values were 2-sided and considered to be statistically significant for p values <0.05.
Results
The baseline characteristics of the study participants were comparable by case-control status (Supplementary Table 1). However, compared to controls, cases were more likely to have been smokers, to not have a history of bilateral oophorectomy, to not have used postmenopausal hormone therapy, and to have had BBD with epithelial hyperplasia with/without atypia. In the epithelium, adipose tissue, and stroma, there were strong positive correlations between the IR and RS scores and a strong negative correlation between AAD and RS (Supplementary Fig. 1c). Other correlations were weak to modest.
Senescence scores and risk of breast cancer
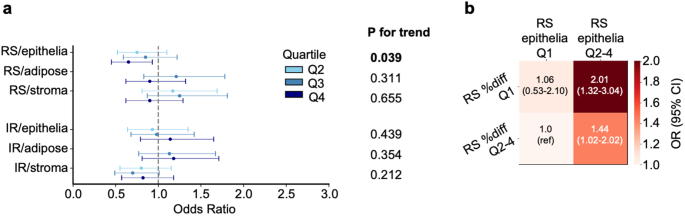
The overall associations between senescence scores and IBC risk, analyzed by senescence inducer and tissue type, are preseFig. in Fig. 2a (and Supplementary Tables 2–3). The RS- and IR-derived senescence scores in adipose tissue were positively associated with the risk of IBC (RS model: ORq4 vs. q1 = 1.69, 95% CI 1.03–2.77, and IR model: ORq4 vs. q1 = 1.73, 95%CI 1.06–2.82); in addition, the RS-derived score for epithelial tissue showed a positive association with risk (ORq4 vs. q1= 1.53, 95% CI 1.05–2.22). In contrast, the IR and RS senescence scores in the stroma and TDLUs were not associated with IBC risk. Furthermore, there was no association between any of the senescence scores obtained using the AAD model, as well as any of the individual components of the model (ANTI, ATVR and DOXO) and breast cancer risk (Supplementary Table 4). Of the IBC cases, 276 (53.9%) were ipsilateral, 212 (41.4%) were contralateral, and 24 (4.7%) had no information on the affected side. The RS and IR scores in adipose tissue, and the RS score in epithelial tissue, were positively associated with risk of ipsilateral IBC (adipose tissue: RS ORq4 vs. q1 = 1.86, 95% CI 1.03–3.36, and IR ORq4 vs. q1 = 1.83, 95% CI 1.02–3.29, and epithelial tissue: RS OR q4 vs. q1 1.71, 95% CI 1.08–2.70); while there were suggestive increases in the risk of contralateral breast cancer in association with these senescence measures, the associations were not statistically significant (Supplementary Table 5).
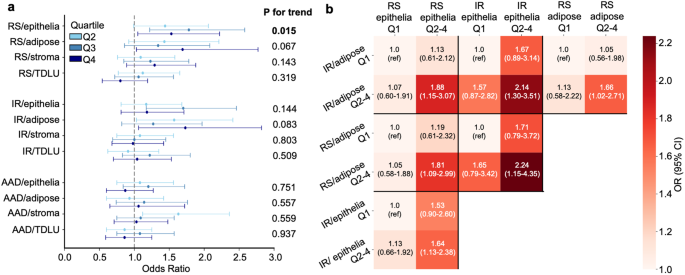
In analyses based on cross-classification by RS and IR senescence scores in epithelial and adipose tissue, there was an increased risk of IBC for those with higher scores on both measures compared with those with low senescence scores on both (Fig. 2b, Supplementary Tables 6–7). For example, for IR epithelium and IR fat, the ORq2−4 vs. q1 was 2.14 (95% CI 1.30–3.51), and for IR epithelium and RS fat the ORq2−4 vs. q1 was 2.24 (95% CI 1.15–4.35).
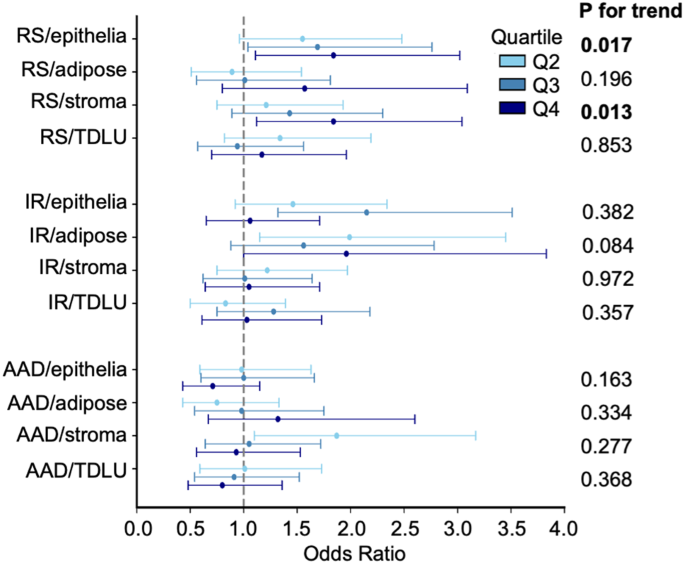
Analyses stratified by menopausal status showed positive associations between RS senescence scores measured in epithelial and stromal tissue and risk of IBC in postmenopausal women (epithelium: ORq4 vs. q1 = 1.84, 95% CI 1.11–3.02; and stroma: ORq4 vs. q1 =1. 84, 95% CI 1.12–3.04) (Fig. 3, Supplementary Tables 8–9). However, no association was observed in premenopausal women.
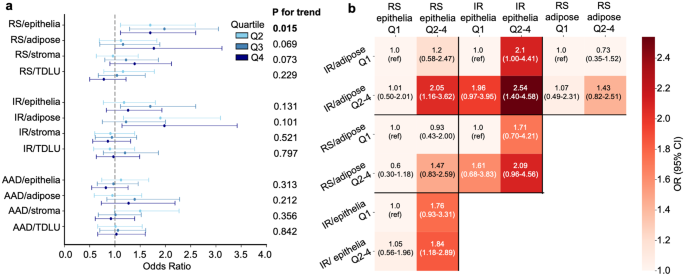
Approximately 80% of the BBDs were classified as epithelial hyperplasia with/without atypia, and in this histological subgroup, the results were similar to those observed overall (Fig. 4a, Supplementary Tables 10–11). In contrast, in women with no lesions or non-proliferative lesions, no associations were observed. Cross-classification analyses by RS and IR senescence scores in epithelial and adipose tissue, restricted to women with epithelial hyperplasia, showed results similar to those obtained overall (Fig. 4b, Supplementary Table 12).
Spatial decay metrics and risk of breast cancer
For individuals whose spatial patterns of cellular senescence yielded a good fit to negative exponential curves (73.5% for epithelium, 48.3% for adipose tissue, 76.4% for stroma), there was no association between half-life scores and risk of IBC (Supplementary Tables 13–14); in contrast, in the epithelium, the group with no half-life data was at higher risk of IBC compared to the group with half-life data (OR 1.34, 95% CI 1.00-1.81). In addition, percent-difference, another metric that indicates the magnitude of senescence score change by distance, was inversely associated with risk of IBC (RS epithelium: ORq4 vs. q1= 0.65, 95% CI 0.45Fig. ) (Fig. 5a and Supplementary Table 14). Cross analysis of the RS senescence scores and the percent-difference metric in the epithelium showed an increased risk of IBC for women with higher senescence scores (q2-4) and lower spatial decay (q1) with OR = 2.01, 95% CI 1.3Fig. 4 (Fig. 5b).
Discussion
Cellular senescence was initially identified as a mechanism to limit uncontrolled cell proliferation [20] and later proposed as a mechanistic link between age-associated cancer and degenerative diseases [21]. However, its paradoxical role in either protecting against or promoting cancer development is now thought to depend on whether or not senescent cells are also associated with secretion of various soluble inflammatory signals and cytokines referred to as the senescence-associated secretory phenotype (SASP) response [21]. Beyond controlled experimental models subjected to well defined senescence inducers (e.g., replicative arrest, ionizing radiation, or vetted proteotoxic drugs like doxorubicin, antimycin-A, and atazanavir-ritonavir), senescence as it occurs naturally in normal or aged human tissues remains poorly characterized due to the lack of specific and universal senescence biomarkers [22]. Biomarkers commonly associated with senescence (e.g., p16, p21, and SA-β-gal) have also been associated with other biological conditions so they do not exclusively identify senescent cells. Overcoming this limitation compels investigators to measure multiple biomarkers simultaneously, although there is little consensus regarding the right combination of markers for a given mammalian tissue. Recognition of this obstacle has led to major scientific initiatives such as the NIH’s SenNet Consortium, tasked with biomarker identification and mapping of senescence cell populations across a wide range of normal human tissues using the latest multiomic platforms [23, 24]. In parallel with such biomarker and mapping initiatives, recent deep learning approaches have shown promise in detecting senescent cells in H&E-stained normal tissues composed of heterogeneous cell types, based solely on nuclear morphology features [9]. These efforts have led to the development of specific deep learning models that use known senescence inducers resulting in scores that correspond to multiple senescence biomarkers and that can predict cellular senescence with high accuracy. These models have been shown to predict future risk of breast cancer in women with normal breast tissue solely using whole slide images obtained on average of 4.8 years before the cancer was diagnosed [10].
In the prospective study reported here, we have extended the use of these deep learning models to estimate IBC risk in women with BBD, to our knowledge the first use of senescence models in women with this condition. Specifically, in a study with a mean interval of 8.9 years between the BBD diagnosis and subsequent development of IBC, we observed positive associations between RS model-predicted senescence scores in epithelial and adipose tissue and IR model-predicted senescence scores in adipose tissue and risk of IBC; these associations were stronger for the risk of developing ipsilateral IBC than of contralateral breast cancer. In contrast, no association was observed between senescence scores obtained using the AAD model and the risk of IBC. Subgroup analyses by menopausal status and by BBD histological characteristics showed associations similar to those observed overall for postmenopausal women and for those with epithelial hyperplasia. Further, in postmenopausal women, a dose-dependent positive association was observed between RS-predicted senescence scores in the stromal tissue and risk of breast cancer. Analysis of the spatial distribution of senescent cells within the tissue showed an inverse association between the risk of IBC and the percent-difference of epithelial RS scores. Further analyses in which binary combinations of senescence scores obtained using the RS and/or IR models in epithelial and adipose tissues were examined indicated that women with higher levels of senescence on both measures had, in most cases, a two-fold increased risk of breast cancer compared to women with low senescence scores. Additionally, the combination of a high senescence score and low percent difference, with both measured in epithelial tissue using the RS model, was associated with a two-fold increase in the risk of IBC compared to those with a low senescence score and high percent difference.
It is of interest to compare these results to those from the Komen Tissue Bank (KTB) where the same senescence models were used to predict breast cancer risk, although caution is warranted given the differences between the studies [10]. The KTB was a study of women without breast disease in whom only 86 cases of incident invasive breast cancer were ascertained compared to the 529 cases of invasive breast cancer in women with BBD studied here, and furthermore the outcome in the KTB study included cases of in situ cancer and invasive cancer while the current study included only women with invasive breast cancer. Notwithstanding these differences, the KTB study did demonstrate statistically significant increased risk associated with IR fat, an increased risk that did not reach statistical significance in RS fat and RS epithelium, consistent with the results of the present study. Of note, TDLUs had no association with risk in any of the models in either study, and we speculate that the high turnover and hormone regulation of TDLU cells avoids senescence checkpoints, that senescence is less effective in controlling malignancies in TDLUs, or that the inflammatory SASP produced by other tissues has a role in cancer origination in TDLUs. The most notable difference between the two study results was that the AAD model was associated with lower risk in the KTB but had no association here. Despite this difference, the AAD model scores had negative correlations with the RS and IR model scores in both studies for both fat and epithelial cells, yet the RS and IR model scores had positive correlations with each other for both tissues in both studies (Supplementary Fig. 2a). Additionally, both studies showed similar correlations between tissue types by model (Supplementary Fig. 2b). The similarity of the correlations in the two studies within and across models reflects positively on the precision of the senescence scores. We speculate that AAD captures a weaker form of senescence with a reduced SASP and has less relevance to BBD where proliferation has already been established.
The spatial distribution of senescent nuclei also appeared to be associated with IBC risk. We found some evidence for an exponential decline in RS epithelial scores near high scoring nuclei, and individuals with a larger decline (upper 3 quartiles) showed reduced risk. The lowest quartile included individuals with a poor fit that did not show a declining exponential pattern or downward trend. This perhaps suggests that declining scores are indicative of greater ability to limit senescence or control senescence inducing factors. Additionally, the half-life metric could not be calculated for those with a poor fit, where senescence scores did not decline with distance, and those individuals showed increased risk, possibly due to uncontrolled senescence. Cross classification between RS percent difference and RS/epi yielded an OR of 2.01 for low percent difference and high RS/epi, suggesting the spatial distribution of senescence is an independent risk factor from overall predicted senescence.
This study has several strengths. The study was conducted in a defined population, the sample size was substantial, and the benign breast lesions were subjected to standardized histological review conducted by a pathologist blinded to case-control status. Also, the risk factor information was collected using a standardized chart abstraction form to obtain data from the KPNW medical records, which have been shown to be of high quality [25, 26]. Concerning limitations, although the study was relatively large, we had limited statistical power to perform analyses separately for those with atypical hyperplasia. The absence of associations in those who developed contralateral IBC and in premenopausal women may also have resulted from limited power. Furthermore, we were unable to distinguish the specific BBD lesions from surrounding normal tissue when generating the senescence scores.
Conclusions
The results of this study indicate that predicted senescence scores and their distribution in epithelial and adipose tissue are related to the risk of developing breast cancer for women diagnosed with benign breast disease. Multiple predictor models indicated increased risk along with spatial distribution patterns when analyzed in combination. Taken together, these findings suggest that senescence scores potentially capture biological mechanisms related to the development of breast cancer. Application of these analytical tools in other cohort studies may provide additional information on the validity of the tools for the identification of women at risk. Our findings may suggest a novel approach to improve cancer risk assessment in millions of BBD patients that requires only H&E-stained slides already obtained during biopsy.
Data availability
Histology images and clinical data are available from the Albert Einstein College of Medicine and Kaiser Permanente with an appropriate data sharing agreement.
References
-
Pederson HJ, Pratt D, Calhoun BC. Surgical de-escalation: are we ready for ‘observation’ of benign high-risk breast lesions found on core needle biopsy? Cleve Clin J Med. 2023;90(7):433–8.